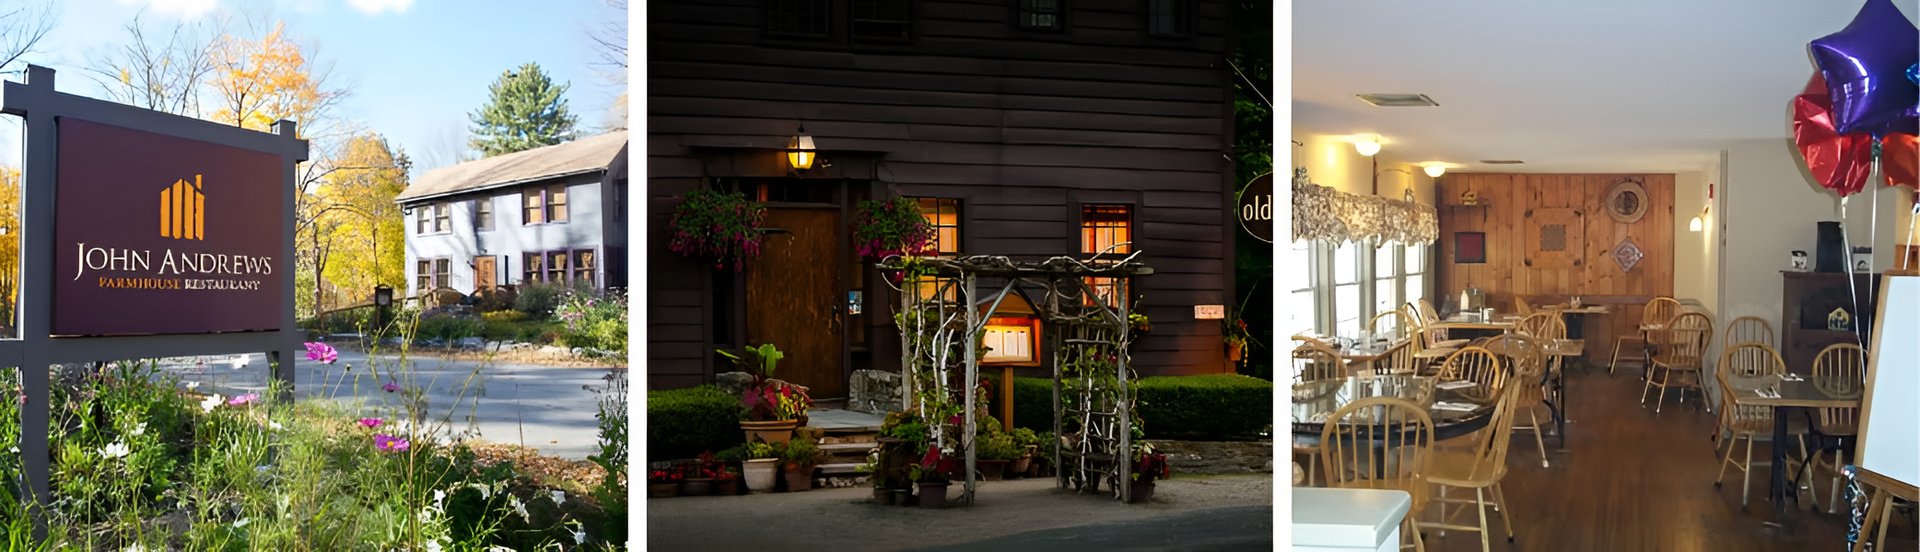
Egremont is known for its outstanding restaurants. Three of the most top-rated are John Andrews Farmhouse Restaurant (left, photo by Michelle Girard), The Old Mill (middle), and Mom's Country Cafe.
1,274 people live in Egremont, where the median age is 53 and the average individual income is $61,551. Data provided by the U.S. Census Bureau.
Total Population
Median Age
Population Density Population Density This is the number of people per square mile in a neighborhood.
Average individual Income
There's plenty to do around Egremont, including shopping, dining, nightlife, parks, and more. Data provided by Walk Score and Yelp.
Explore popular things to do in the area, including Great Barrington Farmers' Market, Cook And Larder, and Domaney's Discount Liquors.
| Name | Category | Distance | Reviews |
Ratings by
Yelp
|
|---|---|---|---|---|
| Dining · $$ | 4.33 miles | 5 reviews | 5/5 stars | |
| Dining | 4.42 miles | 6 reviews | 5/5 stars | |
| Dining · $$ | 4.65 miles | 38 reviews | 4.9/5 stars | |
| Dining | 4.27 miles | 11 reviews | 4.8/5 stars | |
| Dining | 4.31 miles | 11 reviews | 4.8/5 stars | |
| Dining · $$ | 4.23 miles | 5 reviews | 4.8/5 stars | |
| Shopping | 4.24 miles | 4 reviews | 5/5 stars | |
| Active | 4.34 miles | 15 reviews | 5/5 stars | |
| Active | 4.24 miles | 14 reviews | 5/5 stars | |
| Active | 4.34 miles | 16 reviews | 4.9/5 stars | |
| Active | 3.96 miles | 4 reviews | 5/5 stars | |
| Active | 4.52 miles | 4 reviews | 5/5 stars | |
| Beauty | 4.53 miles | 9 reviews | 5/5 stars | |
|
|
||||
|
|
||||
|
|
||||
|
|
||||
|
|
||||
|
|
Egremont has 519 households, with an average household size of 2. Data provided by the U.S. Census Bureau. Here’s what the people living in Egremont do for work — and how long it takes them to get there. Data provided by the U.S. Census Bureau. 1,274 people call Egremont home. The population density is 76 and the largest age group is Data provided by the U.S. Census Bureau.
Total Population
Population Density Population Density This is the number of people per square mile in a neighborhood.
Median Age
Men vs Women
Population by Age Group
0-9 Years
10-17 Years
18-24 Years
25-64 Years
65-74 Years
75+ Years
Education Level
Total Households
Average Household Size
Average individual Income
Households with Children
With Children:
Without Children:
Marital Status
Blue vs White Collar Workers
Blue Collar:
White Collar: